It’s that time of year again! If your Fiscal Year ends on December 31, you’ve probably been asked to start compiling your data in preparation for your 2017 operating budget. There is no doubt that the budget process can be grueling, but with a good strategy and some preparatory “leg work”, you can see the process through and produce some valid numbers that you can rely on for next year. The last thing that any manager wants to see is a budget that is not based on given, reliable history.
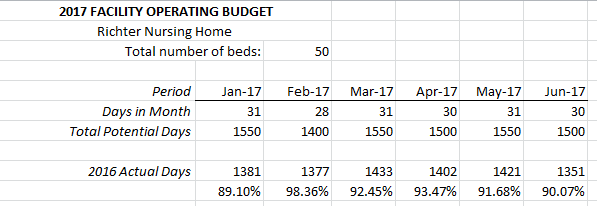
Occupancy - Begin by reviewing your occupancy for the past 12 months. If you work in a 100-bed facility, how many patient days did you have each month? Your EHR package may have a daily or weekly census report that will show your occupancy percentage for that period of time. If your facility normally operates with 1 or more open beds, it would not make sense to project 100% for the next fiscal period. Base your total facility occupancy based on either actual monthly numbers for the prior year, or a general percentage of 95%, for example. Many providers experience a higher rate of occupancy in the winter months due to slips, trips, and falls or the health-related challenges faced by the elderly in the colder weather. It’s perfectly fine to project 100% occupancy for those periods, and a lower rate for the summer months. If a report is not available, an Excel worksheet will do the trick!!
After you’ve identified your monthly percentage of occupancy, break that down into the payer mix for that period. The payer mix will tell you the source of your room and board revenue. Do you focus on skilled rehab? Or is your population largely long-term custodial care?
You may choose to break your analysis down into PPD – or patient day numbers. For example, our 362 Medicare A residents in January equates to 11.67 residents per day. Medicaid in January equates to 22.41 residents per day. If these numbers represent a reliable standard, this daily average can be the basis for your payer mix going forward. These PPD – or “per patient day” numbers can also be used to analyze and project other facility expenses such as medical supplies, and even utilities! Another way to analyze this is to look at your totals by payer for the year, and calculate the percentage of the total days:
Payer Mix – Now that you’ve taken a look at your facility history for the last year and identified any trends or decided to engage in a new line of business, it’s time to project your occupancy and payer mix for the next year. Your Excel worksheet will help you to easily project where you want to project your occupancy and revenue for the next year. For example, perhaps your facility is currently engaged in a marketing program to enhance your Medicare and Skilled census. You may want to show a gradual increase in the projected Medicare census based on your new and fruitful relationship with your local hospital. If your state now has a Managed Medicaid product – where it did not last year, by all means take those new payers into consideration when planning for next year. Let’s use our average percentage of occupancy by payer to project out our payer mix for next year:
Rates – Your annual market study should include a thorough market analysis of the daily rates charged by your competition. Do they plan an increase? If your services are comparable, and your facilities compare “visually”, pricing yourself significantly higher than your neighbors may pose a challenge when you are trying to attract a private pay population. Many factors go into the calculation of room and board rates. The facility must make sure to cover all expenses including the cost of care, utilities and payroll. Base your standard room rates on what covers your expenses, and also what the market will bear. We will project that our room and board rate for 2017 is going to be $250 per diem.
Revenue - Now you can use your newly projected room rates and your payer mix for 2017 to prepare a revenue projection for the next year. This projection shows the gross room and board revenue expected for each payer. Keep in mind that many payers do not reimburse your facility at the standard room and board rate.
The difference between your gross revenue and what you are actually paid by the provider is called a contractual allowance. You will want to factor that adjustment into your budget calculations so that you do not over- or under-project your revenue for a specific payer. This net revenue calculation is based on the provider reimbursement rate and is a more accurate representation of the anticipated revenue for each payer. It is already including the adjustment for the contractual allowance, although for accounting purposes, you may want to show this as a two-step process. Here we see that because of the RUGS rates applied by Medicare and Medicare Advantage products, our anticipated net revenue is actually higher than our days times the standard rate.
Once you have thoroughly analyzed your census and payer history and charted your course for the upcoming year, you are well on your way to establishing a fact-based workable budget for your facility!
Happy Budgeting!!
Subscribe to our newsletter to receive the latest articles and updates aimed at helping you enhance operational, clinical and financial outcomes.